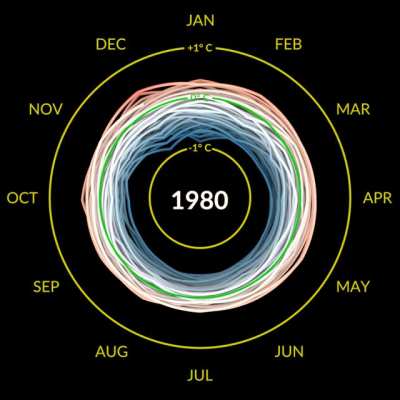
NASA released a spiral chart to visualize the global temperature change between 1880 and 2021 Wildly Interesting